Last Sold: How often are Australians buying homes? New data reveals surprising trend in property sales
New data has identified how often Aussies are buying homes, with surprising results.

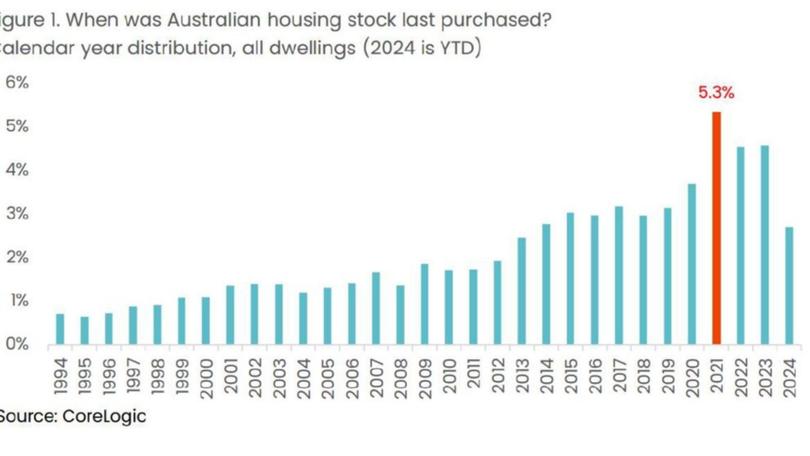
Data recently released from CoreLogic has identified that one in five homes in Australia were purchased in the last five years.
Instead of looking at the amount of property transfers made it a year as provided by the Australian Bureau of Statistics (ABS), CoreLogic looked at the year of the last transfer for properties.
A total of 5.3 per cent of all Australian homes were last purchased in 2021, which equates to over 500,000 homes.
Sign up to The Nightly's newsletters.
Get the first look at the digital newspaper, curated daily stories and breaking headlines delivered to your inbox.
By continuing you agree to our Terms and Privacy Policy.Why was 2021 the year to see the most home purchases?
There are several reasons, not limited to low interest rates, high consumer sentiment, the HomeBuilder Incentive and high annual growth rates in home values.
During 2020 and 2021, various states and cities in Australia were either under lockdown, or reduced activity, meaning those who maintained steady employment during that time were spending less disposable income and could save more for deposits.
When were properties purchased in the last 30 years?
The CoreLogic data goes back to 1994 and tracks each year up to July 2024 with a clear spike in 2021.
Low interest rates in 2021 of around 2.4 per cent, compared to 7.24 per cent in 2024 meant mortgages were more manageable.
Interest rates had been steadily dropping and remained constantly low throughout all of 2021, when the cash rate bottomed out at 0.1 per cent.
With interest rates remaining steady, it led to consumer sentiment rising, and with extra money in their bank accounts, home buyers felt more confident to buy properties.

When looking at the Figure 1 graph provided by CoreLogic, it is interesting to see the purchasing of houses in Australia increase steadily since 1994, except for the dip during the GFC and early 2000’s.
Whilst the percentage of houses purchased has decreased since 2021, the numbers are still higher than they were pre-pandemic.
CoreLogic also looked at each capital city, and the results were actually surprising.
Nearly a quarter of all homes in Brisbane have sold in the past 5 years, whilst Perth is currently the hot market, hitting its peak of sales in 2023 and currently seeing 3.2% of all homes in Perth sell in 2024 so far.
Melbourne and Sydney were quite similar in their trends, whilst Hobart didn’t have a peak in 2021, instead having the highest number of homes purchased in 2017.
Those who bought in 2017 are likely to have seen an increase in the value of their home, with CoreLogics home value index for Hobart rising 45.7 per cent between December 2017 and July this year.
What does this mean for property prices?
One of the reasons outlined for 2021 seeing the greatest number of homes sold was due to increased growth in home values.
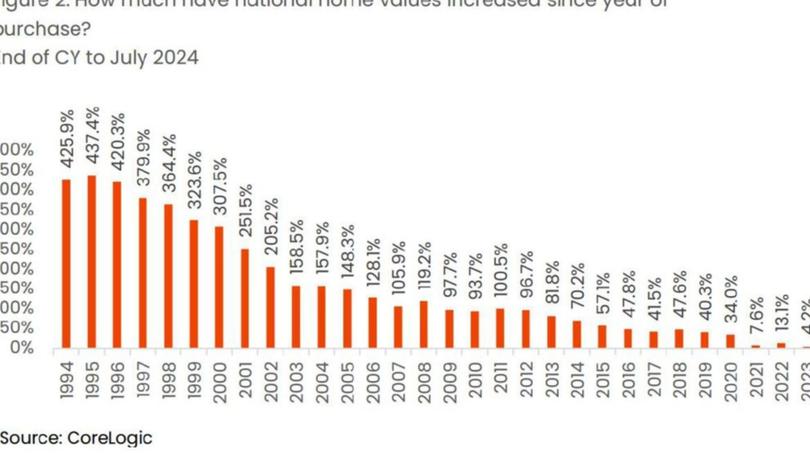
Over the same time period as the house purchase data, CoreLogic also put together a graph of how much property values have increased from the end of 1994 to July 2024.

One could argue then that the many Australians who purchased in 2021 were incentivised into the market at a higher-risk time. Average loan sizes reported by the ABS escalated quickly (up almost 18 per cent over the year), and buying close to the market peak means there may be higher risk of low capital returns or value loss in the face of higher debt costsEliza Owen, CoreLogic Head of Research
Properties sold in 1994 have seen about 425 per cent growth in the value of the property, whilst homes sold in 2023 have seen just over 4 per cent growth.
However, when we look deeper into the market in 2021 and the activity since, it does paint a concerning picture.
We have seen the average mortgage increase by 3.3 per cent since 2021, which means monthly repayments on the average mortgage have increased by nearly 50 per cent*.
*Based on monthly payments for a 30 year loan term, and a 335 basis point increase on a new loan taken out in 2021 at 2.4 per cent pa.
Many recent home buyers are likely grappling with the significant shifts in mortgage rates and economic conditions. The Reserve Bank of Australia (RBA) reported in its March Financial Stability Review that approximately 1 per cent of home loans were in negative equity, while the Australian Prudential Regulation Authority (APRA) noted that just 1.6 per cent of housing loans had past-due mortgage repayments.
To provide context, loan-to-value ratios for new mortgages generally declined throughout 2021. Additionally, over 90 per centof borrowers who secured new loans that year had a deposit of at least 10 per cent, offering a degree of protection against falling home values.
National home values have risen by 7.6 per cent since the end of 2021, according to CoreLogic data. However, recent buyers who entered the market following a brief dip in 2022 may be feeling the pinch. While they have still seen significant capital gains, their returns could be substantially lower than those who purchased earlier in the market cycle.
CoreLogic’s Eliza Owen says: “Buyers in 2024 may not see a strong capital growth return in the short term, but mortgage serviceability is likely to become more manageable over time, with consensus pointing to a decline in the cash rate through 2025 alongside income growth.”
This article first appeared at view.com.au as ‘Last Sold: When was the last time you bought a home?’ and has been reproduced with permission.
Originally published on view.com.au
